
NVIDIA Price Surge Makes Other Chip Plays Desirable: AMD in Focus
27th Feb 2024: NVIDIA (NVDA) stock has seen remarkable growth over the past five years, giving returns well above 1800%. The latest Q4 earnings report didn’t disappoint either, with the AI and semiconductor stalwart beating market expectations by over 3%.
Trading.biz analyst Rahul Nambiampurath believes that despite the massive price surge of over 29% month-on-month, the sell levels for NVDA might not be in yet. “NVIDIA enjoys a staggering 90% share in the AI chip market, and post the Q4 earnings report, levels closer to $950 might not be out of sight,” mentions the analyst.
According to Rahul, if you are a bit sceptical about taking positions in NVIDIA, courtesy of the high valuations, the following chip, automation, AI, and cloud computing plays might be worth considering:
Amazon.com Inc. (AMZN): Up 9.97% month-on-month
Advanced Micro Devices (AMD): Down 0.41% month-on-month
Microsoft Corporation (MSFT): Up 1.59% month-on-month
Alphabet Inc. (GOOGL): Down 5.41% month-on-month
The Trade Desk Inc. (TTD): Up 19.75% month-on-month
Each stock listed above hasn’t surged as aggressively as NVDA, leaving much room for potential price appreciation. Rahul also shifts focus specifically to NVIDIA’s immediate competitor, AMD.
Why AMD Could Be a Game-Changing Investment Play in 2024?
AMD’s strategic placement in the data centre and AI market is worth mentioning. The Q4 revenues, in the data centre realm alone, crossed $2.3 billion, focusing on new data centre GPUs and the Epyc Server CPUs. With the AI market growth expected to hit $1.8 trillion by 2030, AMD does look like a reliable long-term bet.
Even though AMD has projected a softer Q1, 2024, the AI chip sales figures are still projected at $3.5 billion compared to the $2 billion projection from earlier. And while NVIDIA has run away with the price meter, AMD’s growth has been muted and relatively flat over the past 30 days.
AMD Price Chart: Key Levels in Sight
The daily chart of AMD: NASDAQ suggests that a corrective move might be on the cards. The stock tried to breach the lower trendline of the broadening wedge pattern but experienced strong support at the $160 level. The weaker RSI action might facilitate the dip, but Trading.biz analyst Rahul feels that the prices shouldn’t drop below the $158 mark, allowing new traders to enter AMD.
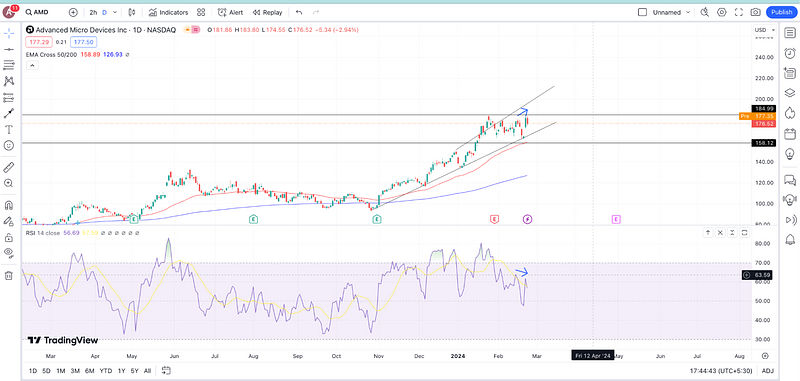
AMD daily chart: TradingView
The $158 also coincides with the 50-day EMA, which is moving aggressively above the 200-day EMA (blue) line, showing that the broader theme is still bullish.
Toshiya Hari, Goldman Sachs’ analyst, still maintains the $180 price level for AMD, which, if breached, can propel the same towards $200.